Buzz: Say Goodbye to Your Local Coffee Shop in America’s Cafe Shakeup

  • Starbucks and other chains gain ground as independents falter
  • Number of cafes shrink in U.S. and Canada in pandemic year

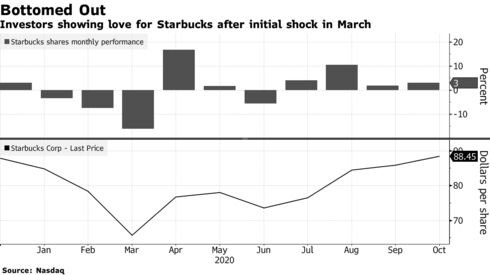
Starbucks Corp. and other coffee chains are expanding their grip on America’s coffee culture as independent cafes struggle to survive a pandemic-fueled industry shakeup.

A worker wearing a protective mask stands behind a plastic barrier inside a cafe in Hudson, New York.Photographer: Angus Mordant/Bloomberg

The number of coffee shops in the U.S. is shrinking for the first time in nine years as sales plunge and Covid-19 forces the industry to rethink its business. That’s helping coffee-serving chains such as Starbucks, Dunkin’ Donuts and even McDonald’s Corp. gain ground at the expense of independent outlets fighting to keep their doors open.

“Closures have happened already and we believe the winter could bring another wave, especially for coffee shops depending on outdoor seating or even walk-up foot traffic,” Rabobank’s senior beverage analyst James Watson said in an interview from New York.

Fewer coffee shops means thousands of lost jobs, adding to an unemployment surge since the start of the pandemic. The shift may also curb demand from specialty coffee producers around the world, since cafe patrons tend to drink more premium beverages made from higher-grade beans.

The U.S. will have 25,307 outlets specializing in coffee or tea by the end of 2020, down 7.3% from a year earlier in the first decline since 2011, according to estimates by research firm Euromonitor International. Annual sales will plunge 12% to $24.7 billion.

“Coffee shops that succeed in this new climate will need try to recreate as many of their popular pre-Covid-19 attributes as before while being in line with the new realities of social distancing,” said Matthew Barry, a beverages consultant for Euromonitor. “This will include moving many aspects online, where personal engagement is still possible without physical proximity.”

Still, Barry sees no scenario in which U.S. food-service coffee consumption returns to its former growth trajectory — though it’ll remain a core part of the industry.

Overall volumes and sales in the coffee food-service industry are expected to fall for the five years ending 2024 while retail coffee sales at grocery stores gain.

Challenging Situations

Larger chains have the resources to handle short- and medium-term losses while also pivoting with conveniences such as online ordering and drive-thru service, Rabobank’s Watson said. Starbucks is planning on a net increase in U.S. stores this year and market gains could be just as significant in 2021, he said.

Starbucks didn’t immediately respond to an email and call seeking comment.

The Seattle-based coffee giant accelerated a rollout of its “pickup” concept — smaller-format stores without tables and chairs — and is enhancing service at its expanding drive-thru locations to cut waiting times. Starbucks also negotiated better leases to prepare for the prospects of future crises that could bring lockdowns, affecting customer traffic.

“We are rapidly innovating in order to capture new demand, new occasions that we didn’t have before that are tied to how customers are currently living their lives,” Chief Financial Officer Patrick J. Grismer said in a presentation last month. “We have moved quickly to open up new channels of distribution at our existing stores, primarily in the suburbs, because there is significant latent demand and there is unmet demand.”

While many independents have proven nimble by adapting their businesses to digital and to-go offerings, they’re still more at risk, Rabobank’s Watson said.

“The most challenging situations have often been based on location, with residential coffee shops far outperforming office/travel based locations,” he said. “Much of survival also comes down to rent negotiations with landlords and the potential for further government assistance –- factors that are hard to control and highly variable.”

Canada has also seen a shrinking number of coffee shops due to the pandemic and the contraction is expected for two more years, according to Allegra World Coffee Portal, a research and consultancy firm. Though 90% of Canadian cafes reopened by September, they face “a long road to recovery in a significantly altered market landscape,” Allegra said in a report.

Canadian coffee-shop sales are expected to plunge 22% to C$9.5 billion ($7.2 billion) this year from 2019 before rebounding to C$10.5 billion next year if the pandemic is largely resolved, according to Allegra estimates.

A return to pre-pandemic levels isn’t expected until 2023, when the industry is anticipated to resume growth. Tim Hortons, owned by Restaurant Brands International Inc., and Starbucks account for three-quarters of Canada’s coffee-shop branded segment.

Canada appears set to buck the U.S. trend favoring Starbucks and other big coffee purveyors.

“With the market currently dominated by branded chains, we expect to see local independents taking a greater share of suburban trade as Canadian consumers seek to diversify their coffee tastes,” Allegra said.

— With assistance by Marcy Nicholson, and Isis Almeida

By Marvin G Perez
October 8, 2020, 3:22 PM EDT Updated on October 9, 2020, 6:00 AM EDT

Source: https://www.bloomberg.com/news/articles/2020-10-08/say-goodbye-to-your-local-coffee-shop-in-america-s-cafe-shakeup?fbclid=IwAR28hg6pqvvxmkQL-FkGF0jfdrKnQoqjLevv0a5zLBZi8lGapyIbUI3cDJw

Buzz: Coffee Caps Worst Week in 22 Years on Overflowing Bean Glut

The world is overflowing with coffee beans, sending futures for the arabica variety to the worst weekly slump since 1998.

The glut is so bad that warehouses in Brazil, the world’s biggest grower and exporter, have never been this full. Trucks in the country’s coffee heartland are waiting days to unload cargo collected from a record crop. Prices in New York, the global benchmark, tumbled 14% this week.

Supplies are piling up just as demand remains weak. Arabica coffee is the smoother variety preferred by roasters like Starbucks Corp. With consumers still proving reluctant to head back to cafes and restaurants in droves, consumption for the premium beans is tepid. By contrast, robusta beans, used in instant coffee and at-home blends, are holding up a bit better.

Robusta futures in London are down less than 2% this year, while arabica has tumbled 12%.

The arabica collapse comes after prices rose in the previous three months. Dry weather in Brazil had sparked concerns over the next harvest, but since then the coffee belt has seen some showers, alleviating the threat.

“Prices fell owing to forecasts of rain in key growing regions” in the South American nation, which should boost yields, Caroline Bain, chief commodities economist at Capital Economics in London, said in a report.

Meanwhile, there are have been some rare deliveries of Brazilian beans to warehouses approved by ICE Futures U.S. That could signal that suppliers in the nation are still holding a big chunk of the 2020 crop.

On Friday, arabica futures for December delivery dropped 3.8% to $1.135 a pound in New York. Prices fell for a fifth straight day.

Coffee settled below the 50-day moving average and approached the 200-day measure, typically seen as bearish signals by some traders.

By Marvin G Perez
September 18, 2020, 4:56 PM EDT

Source: https://www.bloomberg.com/news/articles/2020-09-18/coffee-caps-worst-week-in-22-years-on-overflowing-bean-glut?fbclid=IwAR3oEM61V1TRUeSVEkTGeCKyxXg4n9Cw7AQV58n37-kYuTEKY_N9HDDjZ4A

Find Your Coffee

At cafehound.com, we endeavor to locate the best coffee in the world. Over the last eight years we’ve happily watched as globally, the options available to the public have exponentially increased and the public’s general awareness of specialty coffee has deepened. Although we still believe that tracking down the best coffee in the world is central to our mission, we recently decided to dip our toes into the area of recommending specific coffee(s) to coffee lovers based on a mixture of qualitative and empirical analysis.

espresso_2017

In two posts (1 and 2) from 2015, we took verbal reviews of specialty coffees from the site coffeereview.com,  and we employed various clustering algorithms to discover groupings of coffee (based on words used to describe them and other factors). This served as our initial foray into using Data Science on expert coffee reviews to improve our understanding of specialty coffee.

Over the past month, we’ve set out to improve upon that original work in order to empower java lovers to discover the perfect brew. Our years of cupping coffee and talking with experts have shown that – after a certain point – what constitutes a “good cup of coffee” is subjective and specific to the palette of the beholder.

With that in mind, cafehound.com chose to use a large, multiyear list of coffee reviews from Kenneth David’s coffeereview.com site to explore the relationship between the descriptions used to rate coffee aroma, flavor, aftertaste, body, acidity and finish. We hypothesized that there are distinct groupings of coffee based on their roast profile, body, and flavors that are relevant to informing consumer preferences in the overall marketplace. To clarify, a market segmentation based on a representative sample of surveyed consumer preferences may be more useful to marketing professionals, but that is outside of the scope of this post. Instead, we’re using the structure inferred from math and reviews of specific coffees to estimate categories of the potential “coffee experience.” These categories may provide coffee consumers with guideposts for exploring new specialty coffees.

Our results led to six broad categories of coffee that we’ve ordered from lightest to darkest roast (based on average Agtron ratings). Agtron ratings are a numerical representation of the consistency of the roast color (lower numbers indicate a darker roast <45, higher numbers indicate a lighter roast 50+). More than the roast determines the flavor profile and overall body of the coffee, which is why some of these segments may appear similar.

Initially, we bring this content to you via occasionally updated web pages. Depending on demand, we may scale our service to provide daily or weekly recommendation updates.

For now, follow the link below to Find Your Coffee.

cafehoundlogos01

For code share:

Shiny Segmentation and Prediction

Data Science: Exploring CoffeeReview.com Top Coffees (Cntd.)

In the last post we began exploring the relationship between the language describing coffee (“cupping notes”) and price/brand/roaster. Our objective is to provide coffee consumers with a general understanding of particular groupings of coffee they can choose based on flavor profiles and mouthfeel characteristics. An example of the type of properties coffee professionals use to describe their craft is illustrated in the below flavor wheel from Counter Culture:

CC_FlavorWheel

After evaluating the segments that our initial k-means clustering (with a k of 5) produced, I was unsatisfied with the results. My decision to haphazardly throw the price variable (unscaled) into the model was wrong-headed and drove the algorithm to essentially classify segment membership solely based upon that. In some cases such an exercise may be useful, but for our objective of discerning whether specific language could be used to segment particular specialty coffees, this segmentation wasn’t going to do it for us.

Also, this initial segmentation helped me narrow my “business objective”. Now I wanted to segment by flavor profile, something that might actually help inform a potential consumer’s purchasing decisions.

In order to develop the cupping note variables that would inform our segmentation, I explored the text data from Kenneth Davids’ site and selected the most common and/or most distinguishing words to test. The list of words is below.

wordlist

A quick look at these led me to believe that certain words might not yield significant information gain in the algorithm due to lack of variance. Mouthfeel, sweet and acidity were present in 96%, 80% and 90% of reviews respectively. Their power as differentiating variables would be constrained by their existence in nearly all observations (with the possible exception of acidity).

However, in my initial quick cluster using SPSS, I included the three variables mentioned above and I still liked the results enough to move forward.

Segment 1: 16.9% of reviews

Segment 1: 16.9% of reviews

This segment was the most expensive (average $42.31 USD per pound) and highest rated (94.6). The segment was the highest indexed on floral, honey, complex, silk, delicate, intense, and peach cupping notes. It also indexed highly on nib, lemon and acidity. The most common producer countries in this mix were geisha panama and Colombia, Ethiopian, Kenyan and El Salvadoran coffees.

List of Segment One Coffees 

Seg1_L1 Seg1_L2

Segment 2: 27.8% of reviews

Segment 2: 27.8% of reviews

This segment was the least expensive (average $26.72 USD per pound) and moderately rated (94.45) while coming from the most diverse sampling of producer countries. It indexed highest on rich, deep, resonant and pungent cupping notes. Whereas the other segments did not include any coffees from Bolivia, Brazil, Mexico or Papa New Guinea, this segment did.

List of Segment Two Coffees 

Seg2_L1Seg2_L2Seg2_L3

Segment 3: 13.9% of reviews

Segment 3: 13.9% of reviews

This segment was middle of the road in terms of cost and ratings (average $37.09 USD per pound and rated 94.52 on average). It indexed highest as juicy, tart, acidity, nib, bright, sweet, and was also well above average in complexity and floral notes. The range of producing countries varied quite a bit in this segment, with several bourbon varietals from Guatemala, Costa Rica, Hawaii – still other Geishas from Panama, Colombia and Guatemala – several Ethiopian Yirgacheffe coffees and a few honey processed coffees from El Salvador (Pacamara) and Hawaii (Maragogype ($75/lb)).

List of Segment Three Coffees 

Seg3_L1 Seg3_L2

Segment 4: 20.3% of reviews

Segment 4: 20.3% of reviews

This segment was the least expensive ($28.46 USD per pound) and lowest rated (94.33) – all things relative to a very highly rated group of coffees. It indexed highest for fruit, sweet, lemon and light while also coming in pretty strong in the tart department as well. This segment is composed of a mixture of coffees from Ethiopia, Kenya, Burundi, Indonesia and Honduras. A few peaberry coffees are included, the red caturra from Rusty’s Hawaiian, a few stray Geisha coffees, and a decently heavy sampling of Sumatra, Yirgacheffe, Sidamo, and various Kenyan single-origins. For the value, this is a very attractive and diverse segment of coffees. See our site visit to Rusty’s in Hawai’i in 2011.

List of Segment Four Coffees 

Seg4_L1 Seg4_L2

Cupping With Miguel At Lorie's Home

Cupping With Miguel At Lorie’s Home

Segment 5: 21.1% of reviews

Segment 5: 21.1% of reviews

Segment five is highly rated (94.58) and quite expensive ($37.73 USD per pound on average). This segment indexes the highest for tart, rich, acidity, syrup, pungent, and mouthfeel, while also scoring highly for honey and bright notes. Panama, Colombia, Hawaii and Ethiopia are the most heavily represented producer countries in this grouping. This segment is probably the most populated by Geishas followed by exotic Ethiopian and Kenyan coffees.

List of Segment Five Coffees 

Seg5_L1Seg5_L2


For more information on the roasters evaluated in this data from the coffeereview.com website, see the links and data below:

ML_1ML_2ML_3ML_4

And I’ll leave you with a bit of a refresher on the Cup of Excellence Scoring Categories for thinking about and communicating coffee quality/taste.

Cup of Excellence® Scoring Categories

DEFECTS

Phenolic, rio, riado automatic disqualification Ferment
Oniony, sweaty

CLEAN CUP
+ purity | free from measurable faults | clarity – dirty | earthy | moldy | off-fruity

SWEETNESS (prevalence of…)
+ ripeness | sweet
– green | undeveloped | closed | tart

ACIDITY
+ lively | refined | firm | soft | having spine | crisp | structure | racy – sharp | hard | thin | dull | acetic | sour | flabby | biting

MOUTHFEEL (texture, viscosity, sediment, weight, astringency)
+ buttery | creamy | round | smooth | cradling | rich | velvety | tightly knit – astringent | rough | watery | thin | light | gritty

FLAVOR (nose + taste)
+ character | intensity | distinctiveness | pleasure | simple-complex | depth

(possible notations: nutty, chocolate, berry, fruit, caramel, floral, beefy, spicy, honey, smokey…)

– insipid | potato | peas | grassy | woody | bitter-salty-sour | gamey | baggy

AFTERTASTE
+ sweet | cleanly disappearing | pleasantly lingering
– bitter | harsh | astringent | cloying | dirty | unpleasant | metallic

BALANCE
+ harmony | equilibrium | stable-consistent (from hot to cold) | structure | tuning | acidity-body – hollow | excessive | aggressive | inconsistent change in character

OVERALL (not a correction!)
+ complexity | dimension | uniformity | richness | (transformation from hot to cold…) – simplistic | boring | do not like!

Data Science: Exploring CoffeeReview.com Top Coffees

Over the past few years, I’ve transitioned my career from government-oriented management consulting to the field of advanced analytics and data science.


In general terms, this has required me to climb a significant learning curve in the related areas of computer programming languages and advanced statistical methods. While it has been challenging, the rewards of being able to more effectively and efficiently extract insights from various types of information/data is encouraging.

With the objective of exploring my love of specialty coffee, I chose to practice a few basic data science methods on a relatively well-known specialty coffee review website: coffeereview.com .

The goal was to apply web scraping, text analytics, segmentation, and some visualization techniques to coffee review data in order to explore correlations between price, producer country, roaster, and quality over time.

My colleague and I discussed the objective over Memorial Day weekend and set out on parallel paths to scrape review data from the website. He used a Python script to scrape the website, and I used an R script to do the same. In the end, his Python script achieved a more efficient scrape, producing a column separated variable (.csv) file that could be imported into a statistical computing software package like SPSS or R.

The website we targeted in this scrape was the 21 pages of: http://www.coffeereview.com/highest-rated-coffees/


From there, I cleaned up the file (using R packages such as “dplyr”, “stringr” and “sqldf” to get things to a point where we could calculate price per pound amounts and country of origin for most of the coffees reviewed. I was also able to pull down city/state location data for each of the roasters and their websites.

One of my first business questions involved the type of descriptive language used to review the website’s top-rated coffees. Where there any particular words that we could associate with the best rated coffee out there, according to coffeereview.com?

A relatively straightforward way to investigate that question is to use a Word Cloud to illustrate the words with the highest frequency of mention in individual review comments.

Most frequent words describing top rated coffees.

Most frequent words describing top rated coffees.

Clearly, if you want to appear to know the jargon for communicating your delight about a quality cup of java, you should say something like, “This coffee’s intense aroma of flowers, baker’s chocolate and fruit is only bested by its complex, rich flavor with tart tinges of acidity and a balanced, silky, syrupy, honey finish…”. Okay…so that sounds ridiculous…but you get the point.

Exploring the data

What is the range of ratings found on the top rated page?

The maximum rating any single coffee receives on this page (of highest rated coffees) is 97, while the minimum is 94. There isn’t a lot of variance. Most of the top rated coffees are rated 94, a third are 95, and the remaining15 percent are either 96 or 97. We will revisit this data later.

Distribution of Top Rated Coffees from CoffeeReview.com

Distribution of Top Rated Coffees from CoffeeReview.com

What years of ratings do we have the most robust data for in order to do more specific analysis on our variables?

We decided to drop all years prior to 2010 (which had 29 coffees reviewed that year).

year count
2014 70
2013 58
2012 40
2011 39
2015 24
2010 20
Which coffee roasters were the most frequently reviewed and top rated by coffeereview.com between 2010 and roughly six months into 2015?

JBC Coffee Roasters from Madison, Wisconsin was the favorite by far in terms of its 26 reviews on the website in the time span specified. Followed by Temple Coffee and Tea in Sacramento, CA (20) and PT’s Coffee Roasting Company in Topeka, Kansas (13). This was a surprise to me, as I have never sampled ANY coffee from these roasters and feel like I have been missing out. In order to show the table of roasters, i used the combination of R packages “RGraphics” and “gridExtra” to save some nice incremental (sets of 15) graphics.

roasters_1_15

roasters_16_30 roasters_31_45 roasters_46_60 roasters_61_73

A quick visualization of the top rated coffees by year, price per pound and origin country shows some semi-distinct segments within the data based on price alone. This led me to ponder if we could use a clustering algorithm (such as k-means using dummy variables for each country, price per pound, and rating) in order to more clearly segment particular coffees by segment. Instead of using R for this exploration, I exported the data into a .csv and imported it into SPSS to run the analysis there.

Price per pound by origin country and year ($US).

Price per pound by origin country and year ($US). United States = Hawai’i.

A five-way cluster solution seemed the most suitable for segmenting the data in a way that illustrated differences across price and producer country.

Price unreasonably drove the segmentation, as seen in this graphic.

Price unreasonably drove the segmentation, as seen in this graphic.

The segments broke out into groupings containing the following number of coffee reviews each:

Segment                       Count               $US/lb

1                                       174                   $21
2                                       8                      $121
3                                       35                    $44
4                                       1                       $243
5                                       20                    $84

Segment 1: No Geisha or Hawaiian Coffees, Espresso Blends
Segment 2: Panama and Colombian Geishas
Segment 3: Mix of Geishas, Ethiopian, and Hawaiian
Segment 4: Semeon Abay Ethiopia
Segment 5: Mid-priced Geisha, Hawaiian and Ethiopian

Interestingly, a few roasters exhibited a bit of dispersion across the segments due to the variety of awesome tasting coffees they had reviewed. Those roasters included:

PT’s Coffee Roasting Co.

5 (Seg 1)
3 (Seg 2)
3 (Seg 3)
2 were (Seg 5)

Barrington Coffee Roasting Co.

3 were (Seg 1)
4 were (Seg 3)
1 was (Seg 4)
3 were (Seg 5)

Bird Rock Coffee Roasters

6 were (Seg 1)
1 was (Seg 2)
3 were (Seg 3)
1 was (Seg 5)

Paradise Roasters

6 were (Seg 1)
1 was (Seg 2)
1 was (Seg 3)
2 were (Seg 5)

After exploring the data in this way, I wondered if 1) my approach to segmentation was appropriate 2) what the comments from these segments looked like comparatively. To answer the first question: no, but that will be the topic of my next blog post. To answer the second, let’s explore some word clouds below.

Word Cloud: Segment 1

Word Cloud: Segment 1

Word Cloud: Segment 2

Word Cloud: Segment 2

Word Cloud: Segment 3

Word Cloud: Segment 3

Word Cloud: Segment 4

Word Cloud: Segment 4

Word Cloud: Segment 5

Word Cloud: Segment 5


Perhaps clustering by cupping notes is a better way to segment groups…stay tuned.